- Labor demand up over 600,000 in Q1 2011
- March posts increases for a variety of occupations including food service workers, sales, office help, and building and grounds workers
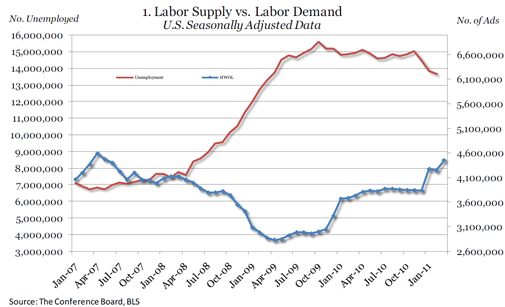
- Labor Supply/Labor Demand (3.22) narrows slightly in February (last available unemployment data) with 9.4 million more unemployed workers than advertised vacancies (Chart 1)
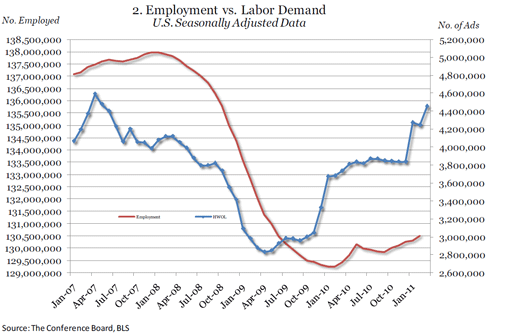
“Thus far in 2011, labor demand is looking strong,” said June Shelp, Vice President at The Conference Board. “In the first quarter of 2011, the monthly increase in advertised vacancies has averaged about 200,000/month. That’s good news after the overall anemic growth in labor demand over the last 11 months of 2010 (Chart 2). In March, almost half of the advertised vacancies were new ads that were not there the previous month (new ads up 98,200). This is a further positive sign that employers are continuing to look for workers.”


REGIONAL AND STATE HIGHLIGHTS
- March posts gains in regions across the U.S. with the South showing the largest gain (86,100)
- Seven States post increases over 10 percent in March (West Virginia, Arizona, Indiana, Missouri, Nevada, Oklahoma, and Utah)
Among the regions, the South posted the largest numeric gain in labor demand, up 86,100, in March. Among the larger States in the region, Texas led the region with a rise of 16,700 and Florida increased by 10,600. North Carolina followed closely behind with a gain of 9,100 while Georgia gained 6,700. Maryland and Virginia increased 3,900 and 3,700, respectively. Among the less populous States in the South, Tennessee gained 5,800. Oklahoma rose 5,500, which is a gain of 14 percent, to 45,600 advertised vacancies in March. Alabama was up by 4,100, and South Carolina gained 2,200.
In March, the Midwest rose 43,700. Missouri posted the largest increase with its gain of 8,600, a 12-percent increase, to 81,000 advertised vacancies. Indiana was up 11 percent (+6,400), and Michigan rose 8,100. Wisconsin and Ohio posted gains of 5,900 and 5,400 respectively while Illinois remained basically unchanged (an increase of 200). Among the States with smaller populations, Kansas increased by 2,300 and Iowa and Nebraska added 2,100 and 2,000 respectively.
The West gained 33,000 this month and was led by the Mountain States. Arizona grew by 10,700, a gain of 12 percent, followed by Nevada, up 11 percent (+4,600), and Utah, also up 11 percent (+ 3,400). Colorado moved up by 1,400. Among the Pacific Coast States, Washington rose 2,800, Oregon increased 2,400, and California inched up by 1,700. Some of the less populous States posting increases included Idaho, New Mexico, and Alaska, rising by 1,700, 1,400, and 1,100, respectively.
The Northeast was up 23,600 in March. New York rose by 9,500 and was closely followed by New Jersey’s gain of 8,600. Massachusetts and Pennsylvania posted gains of 2,900 and 2,500 respectively. Among the smaller States in New England, New Hampshire, Maine, and Rhode Island were up 1,600, 1,000, and 600, respectively. Vermont remained unchanged while Connecticut dipped by 500.
The Supply/Demand rate for the U.S. in February (the latest month for which unemployment numbers are available) stands at 3.22, indicating that there are over 3 unemployed workers for every online advertised vacancy. Nationally, there are 9.4 million more unemployed workers than advertised vacancies. In February the States where there were fewer than two unemployed for every advertised vacancy included North Dakota and Nebraska (Supply/Demand rates of 1.11 and 1.55 respectively) as well as South Dakota and Maryland (both at 1.70). The State with the highest Supply/Demand rate is Mississippi (7.87), where there are almost 8 unemployed workers for every online advertised vacancy. There are a number of States in which there are over 4 unemployed for every advertised vacancy including Kentucky (5.94), Alabama (4.96), West Virginia (4.61), Indiana (4.59), Florida (4.54), and South Carolina (4.49).
It should be noted that the Supply/Demand rate only provides a measure of relative tightness of the individual State labor markets and does not suggest that the occupations of the unemployed directly align with the occupations of the advertised vacancies (see Occupational Highlights section).
OCCUPATIONAL HIGHLIGHTS
Labor demand in March:
- Up for Food Preparation and Serving occupations
- Increases seen for Office and Administrative Support and Sales and Related workers
- Construction and Building and Grounds vacancies rise
Among the top 10 occupation groups with the largest numbers of online advertised vacancies, labor demand for Office and Administrative Support workers increased by 35,800 in March to 485,300 and was led by a demand for tellers, receptionists and information clerks, and hotel, motel, and resort desk clerks. Job opportunities still remain challenging in this occupational category with 3.5 unemployed workers for every advertised vacancy (February 2011 data, the latest available for unemployment).
Sales and Related occupations posted a gain of 28,300 to 589,300; this gain was led by a demand for first-line supervisors/managers of retail sales workers and telemarketers. The number of unemployed in sales occupations remains above the number of advertised vacancies with just under 3 (2.6) unemployed for every advertised vacancy (February data).
Management positions rose by 11,800 to 456,600 and included a gain for food service managers. At the same time, Food Preparation and Serving Related positions grew by 20,900 to 151,500 with a rise in demand for a variety of jobs including waiters and waitresses, first-line supervisors and managers of food preparation and serving workers, and restaurant cooks. However, there are still over 8 unemployed workers (8.57) for every advertised vacancy (February data).
Among other occupations showing gains in March were Building and Grounds workers, up 6,700 to 58,100, Construction and Extraction jobs, up 4,200 to 62,900, Transportation and Material Moving occupations, up 15,400, and Production jobs, up 8,300. Specific advertised vacancies showing increases included heavy truck and tractor-trailer drivers and laborers and hand freight, stock, and material movers.
METRO AREA HIGHLIGHTS
- Washington, D.C., Honolulu, and Minneapolis have the lowest Supply/Demand rates
In March, all of the 52 metropolitan areas for which data are reported separately posted over-the-year increases in the number of online advertised vacancies. Among the three metro areas with the largest numbers of advertised vacancies, the New York metro area was 20.7 percent above its March 2010 level, the Washington, D.C. metro area was 8.7 percent above its March 2010 level, and the Los Angeles metro area was 18.8 percent above last year’s level.
The number of unemployed exceeded the number of advertised vacancies in all of the 52 metro areas for which information is reported separately. Washington, DC continues to have the most favorable Supply/Demand rate (1.32) with the number of unemployed slightly more than the number of advertised vacancies. Honolulu, Minneapolis-St. Paul, Boston, and Milwaukee were metropolitan locations where there were approximately two unemployed looking for work for every advertised vacancy. On the other hand, metro areas in which the respective number of unemployed is substantially above the number of online advertised vacancies include Riverside, CA — where there are over 11 unemployed people for every advertised vacancy (11.39) — Sacramento (6.91), Miami (6.35), and Los Angeles (5.74). Supply/Demand rate data are for January 2011, the latest month for which unemployment data for local areas are available.


