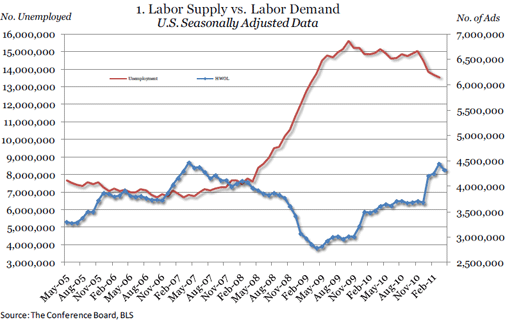
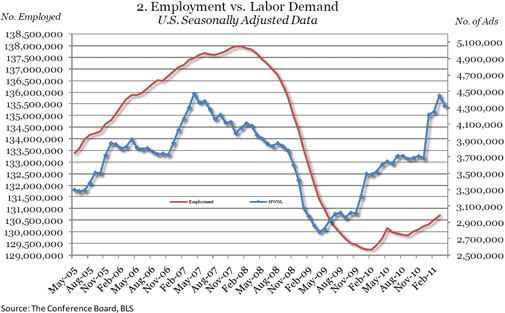
- With gains in Q1, labor demand in April is in line with levels last seen four years ago before the start of the recession
- The number of advertised vacancies for architecture and engineering jobs now exceeds the number of unemployed in this field
“Labor demand has risen to levels we last saw just before the official start of the recession four years ago,” said June Shelp, Vice President at The Conference Board. “At the same time, the number of unemployed has doubled and now stands at 13.5 million (March unemployment data), and some professions have clearly fared better than others in job opportunities. At this stage, there are occupations where the supply/demand rate has fallen significantly and there are two or less unemployed for every advertised vacancy. However, other occupations are still experiencing relatively high supply/demand rates above 4.0, reflecting the fact that there are over four unemployed for every advertised vacancy.”


REGIONAL AND STATE HIGHLIGHTS
- The April dip in labor demand reflects declines in slightly less than half of the States (23) which more than offset gains in the other 27 States
- The trend in labor demand turned up in 2011 in all of the 20 largest states
Among the regions, the South declined 57,700 in April. In addition to Maryland (-23,200), Texas, Florida and Georgia were down 9,300, 8,500, and 7,300, respectively and Virginia was down 4,300. Partially offsetting these losses was a gain in North Carolina, up 3,500. In the first four months of 2011, labor demand in North Carolina has risen 25 percent. Among the less populous States in the South, Tennessee gained 800 and Oklahoma rose 1,200 to 46,100 online advertised vacancies in April. Alabama was up by 500, while South Carolina lost 1,700.
In April, the Midwest held steady, with a slight dip of 700. Indiana, one of the smaller states in the region, posted the largest gain, up 3,400 to 70,300. Among the larger states, Wisconsin rose 2,000 and Missouri was up 1,200. States posting declines in April included Illinois, down 3,300 to 165,800 and Michigan, down 3,600. Ohio rose by 900 and has gained 36,500 (29 percent) in labor demand thus far in 2011. Among the States with smaller populations, Kansas increased by 1,400 and Iowa and Nebraska added 900 and 600, respectively.
The West declined 47,400 this month with losses in some states offsetting gains in others. California had the largest loss with a decline of 36,700; Arizona posted the largest gain (up 1,500) in the region. Colorado and Washington declined 8,400 and 4,200, respectively, while Oregon was down 1,400 to 53,200. Utah declined by 1,600 but its overall increase this year is 6,200 (23 percent). Some of the less populous States posting increases are New Mexico and Idaho which rose 700 and 1,000, respectively.
The Northeast was down by 36,000 in April. In addition to Massachusetts (down 11,500), Pennsylvania declined 8,200 and New York fell by 7,100. New Jersey posted the largest gain in the region with an increase of 3,900 to 144,100. Among the smaller States in New England, Connecticut fell by 11,300 while New Hampshire and Vermont were up by 1,600 and 800, respectively. Maine and Rhode Island remained virtually unchanged with slight gains of 200 each.
The Supply/Demand rate for the U.S. in March (the latest month for which unemployment numbers are available) stands at 3.05, indicating that there are just over three unemployed workers for every online advertised vacancy. Nationally, there are 9.1 million more unemployed workers than advertised vacancies. In March, there were eight States where there were fewer than two unemployed for every advertised vacancy including North Dakota and Nebraska (Supply/Demand rates of 1.08 and 1.44 respectively) as well as Alaska and Maryland (both at 1.60), New Hampshire (1.68), South Dakota (1.75), Vermont (1.76) and Virginia (1.85). The State with the highest Supply/Demand rate is Mississippi (7.30), where there are more than 7 unemployed workers for every online advertised vacancy. There are a number of States in which there are over four unemployed for every advertised vacancy including Kentucky (5.45), Alabama (4.45), California (4.26), South Carolina (4.20), Florida (4.15), and Michigan (4.00).
It should be noted that the Supply/Demand rate only provides a measure of relative tightness of the individual State labor markets and does not suggest that the occupations of the unemployed directly align with the occupations of the advertised vacancies (see Occupational Highlights section).
OCCUPATIONAL HIGHLIGHTS
- The recovery has been uneven across occupations although supply/demand rates have improved in all of the broad occupational categories since the height of the recession
- Computer and mathematical science is the only broad occupational group where the number of advertised vacancies remained above the number of unemployed throughout the recession
Supply/Demand for Selected Occupations
The recession and the current recovery have not treated all occupations equally. How hard, or easy, it is to find job opportunities vary by occupation. Supply/demand rates provide a measure of how many advertised vacancies there are relative to the number of unemployed workers seeking employment in these occupations. In other words, they are an indication of the relative tightness of the labor market for various professions. Some high wage, high-tech occupations that faired best during the recession (computer and mathematical science, and healthcare practitioners and technical workers, for example) are still proving to have the most favorable supply/demand rates.
“While the number of ads relative to the number of unemployed in all of the major occupational categories deteriorated during the recession, for some relatively high-wage, high-tech categories there were always more advertised vacancies than unemployed looking for jobs,” said Shelp. For computer and math occupations, the number of vacancies for unemployed job seekers deteriorated from around nine openings to under two openings as the recession deepened. By last month (March’11) the number of advertised openings was back up to five for every unemployed.
In contrast, in office and administrative work, and food preparation and service, the number of unemployed continues to exceed than the number of vacancies. In food prep and service, for example, there were almost eight unemployed for every advertised vacancy in March’11. “That is a significant improvement from the worst month (May’09) when there were 14 unemployed for every advertised vacancy,” said Shelp, “but not a great comfort to those workers still seeking jobs in this field.”
Nationally, the supply/demand rate for all occupationsin March’11 was 3.05, or three unemployed for every advertised opening. Job categories where there are relatively good opportunities (i.e., not more than two unemployed for every advertised vacancy) in addition to computer and math jobs, include occupations typically called high-tech —life, physical, and social sciences (1.0), architecture and engineering (0.8) — as well as business and financial operations (1.4), management (1.5), and healthcare practitioners and technical (0.37) and healthcare support occupations (1.7).
Occupations where there continue to be a large number of unemployed for every online advertised opening include construction and extraction (22 unemployed for every opening), production jobs (7.9), building and grounds work (11.1), food preparation and service related jobs (7.8), and personal care and service occupations (7.4). “There has been significant improvement in these occupations since the worst months of the recession, but we still have a long way to go to put all of these workers back into jobs,” Shelp noted.
Changes for the Month of April
Among the top 10 occupation groups with the largest numbers of online advertised vacancies, categories posting increases included transportation and material moving, up 3,500 to 204,800 and installation, maintenance and repair, up 2,800. Construction and extraction jobs rose 1,200.
Occupation that posted fewer vacancies in April included healthcare practitioners and technical occupations, down 28,600 to 568,500. This drop was led by declines in advertised vacancies for speech-language pathologists, occupational therapists, and physical therapists. At the same time, healthcare support occupations fell by 11,400 to 129,100. Similar to the decline in healthcare practitioners and technical positions, there were declines in openings for physical therapist assistants and occupational therapist assistants.
In April, office and administrative support vacancies decreased by 14,000 to 459,800. General office clerks, receptionists and information clerks were among the occupations which saw a decrease in advertised vacancies. In the first four months of 2011, office support occupations have gained 59,800. In spite of this increase, job opportunities still remain challenging in this occupational category with 3.45 unemployed workers for every advertised vacancy (March 2011 data, the latest available for unemployment).
Food preparation and serving related positions slipped by 14,400 to 135,300 with a drop in demand for a variety of jobs including dishwashers, cooks for institutions and cafeterias, and food preparation workers. There are still almost eight unemployed workers (7.79) for every advertised vacancy (March data). The overall gain in this occupational category since the end of last year has been 25,900 (24 percent).


