


A pay relative is a calculation of pay - wages, salaries, commissions, and production bonuses - for a given metropolitan area relative to the nation as a whole. The calculation controls for differences among areas in occupational composition, establishment and occupational characteristics, and the fact that data are collected for areas at different times during the year. Simple pay comparisons calculating the ratio of the average pay for an area to the entire United States in percentage terms would not control for interarea differences in occupational composition and other factors, which may have a significant effect on pay relatives.
Pay relatives calculated for all occupations were significantly different from the national average in 65 of the 77 areas. Table A below lists selected metropolitan area pay relatives compared to average pay nationally among those studied in the NCS. Table B provides selected metropolitan area pay relatives for each of nine major occupational groups.
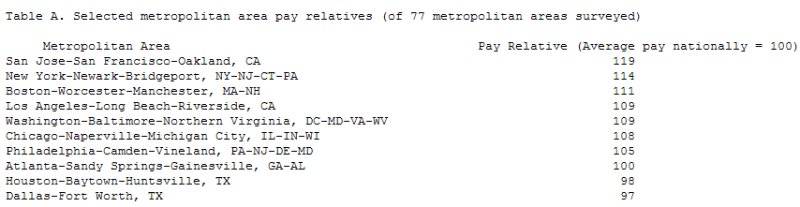
Table B. Selected metropolitan area-to-national pay relatives for nine major occupational groups, 2008 (of 77 metropolitan areas surveyed)
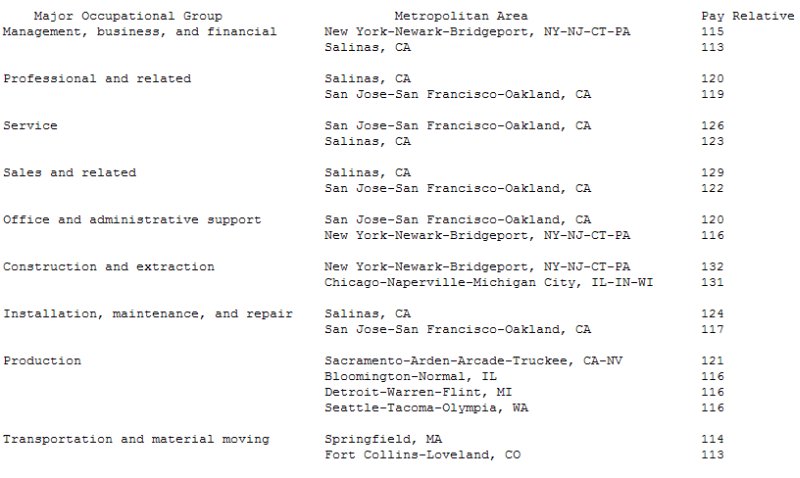
The pay relative for construction and extraction occupations in the New York-Newark-Bridgeport, NY-NJ-CT-PA area was 132, meaning the pay in the New York metropolitan area for that occupational group averaged 32 percent more than the national average pay for that occupational group. By contrast, the pay relative for workers in construction and extraction in the Brownsville-Harlingen, Texas area was 66, meaning pay for workers in those occupations averaged 34 percent less than the national average.
